This material does not constitute an offer or the solicitation of an offer to purchase an interest in McV Compounding Founders Fund LP (the “Fund”), which such offer will only be made via a confidential private placement memorandum (the “Memorandum”). An investment in the Fund is speculative and is subject to a risk of loss, including a risk of loss of principal. There is no secondary market for interests in the Fund and none is expected to develop. No assurance can be given that the Fund will achieve its objective or that an investor will receive a return of all or part of its investment. All statements herein are qualified in their entirety by reference to the Memorandum, and to the extent that this document contradicts the Memorandum, the Memorandum shall govern in all respects.
This material is confidential and may not be distributed or reproduced in whole or in part without the express written consent of McVinney Capital Management LLC (the “Investment Manager”). This material is not intended to provide, and should not be relied on for, tax, legal, or accounting advice. You should consult your own tax, legal, and accounting advisers before engaging in any investment transaction.
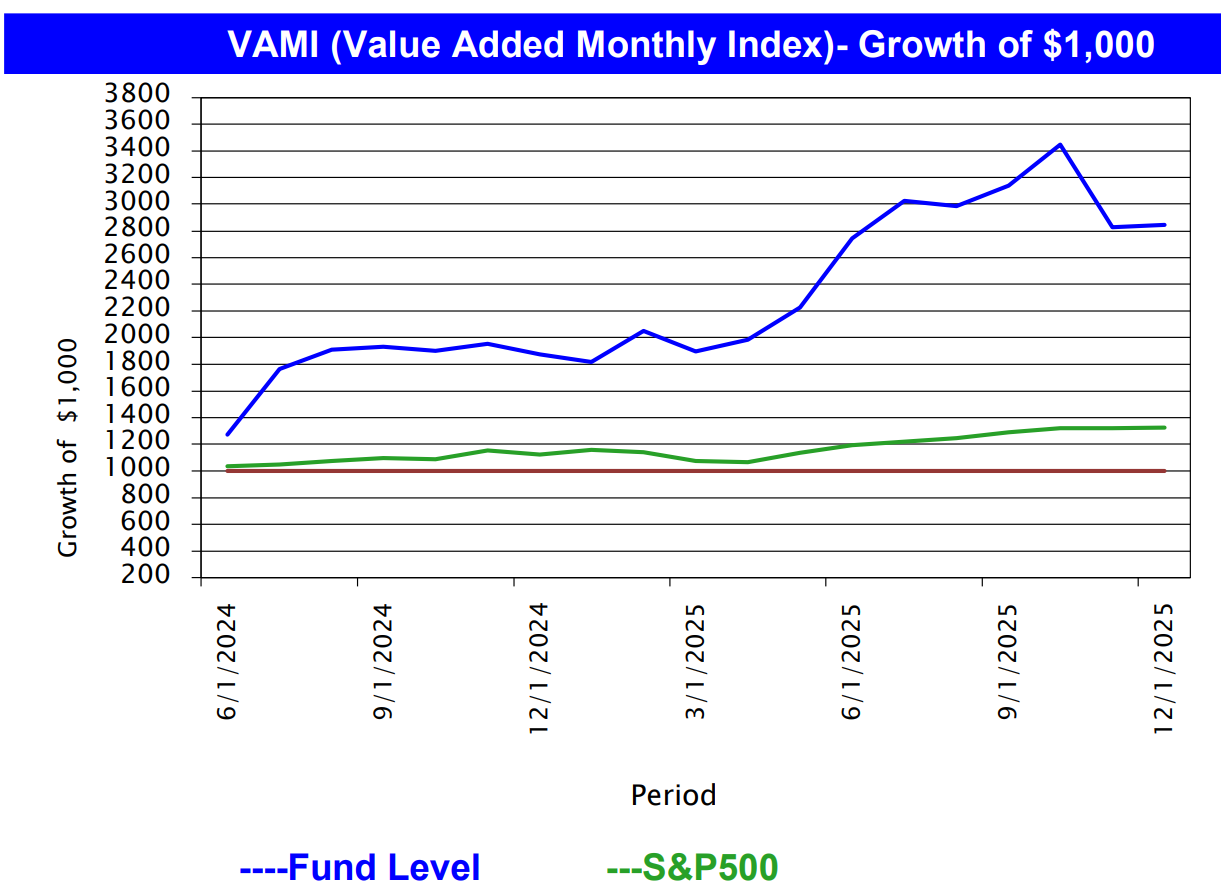
The performance data discussed herein do not represent the performance of the Fund, but rather, represent the performance of a personal account belonging to Joseph V. McVinney, the principal of the Investment Manager, and are included for informational purposes only. Due to the differing circumstances of managing proprietary capital in a personal account and managing outside capital, results generated in the Fund once outside capital is admitted could be materially different than those results shown. The results shown reflect the deduction of: (i) an asset management fee of 0.75%, charged annually in advance; (ii) an annual performance allocation of 15% subject to a hurdle equal to the per annum return of the S&P 500 Index and 30% on returns above a second tier hurdle equal to the per annum return of the S&P 500 Index plus 25%; and (iii) transaction fees and other expenses actually incurred. The management fee and performance allocation were applied retroactively and do not reflect actual fees charged. None of the results shown reflect the deduction of certain organizational and operating expenses common to investment funds, which would serve to decrease profits or otherwise increase losses. Results were achieved using the investment strategies described in the Memorandum.
Results are compared to the performance of the S&P 500 Index and various other indexes (collectively, the “Comparative Indexes”) for informational purposes only. The Fund’s investment program does not mirror any of the Comparative Indexes and the volatility of the Fund’s investment program may be materially different from the volatility of the Comparative Indexes. The securities included in the Comparative Indexes are not necessarily included in the Fund’s investment program and criteria for inclusion in the Comparative Indexes are different than criteria for investment by the Fund. The performance of the Comparative Indexes reflects the reinvestment of dividends, as appropriate.
This material contains certain forward-looking statements and projections regarding market trends, investment strategy, and the future asset allocation of the Fund, including indicative guidelines regarding position limits, exposures, position sizing, diversification, and other indications regarding the Fund’s strategy. These projections and guidelines are included for illustrative purposes only, are inherently predictive, speculative, and involve risk and uncertainty because they relate to events and depend on circumstances that will occur in the future. The guidelines included herein do not reflect strict rules or limitations on the Fund’s investment program and the Fund may deviate from the guidelines described herein. There are a number of factors that could cause actual events and developments to differ materially from those expressed or implied by these forward-looking statements, projections, and guidelines, and no assurances can be given that the forward-looking statements in this document will be realized or followed, as described. These forward-looking statements will not necessarily be updated in the future.
PAST PERFORMANCE IS NOT NECESSARILY INDICATIVE OF FUTURE RESULTS.